
HOME
Back to M6 Toll main page
(page revised February 2016)
M6 TOLL - Daily Traffic
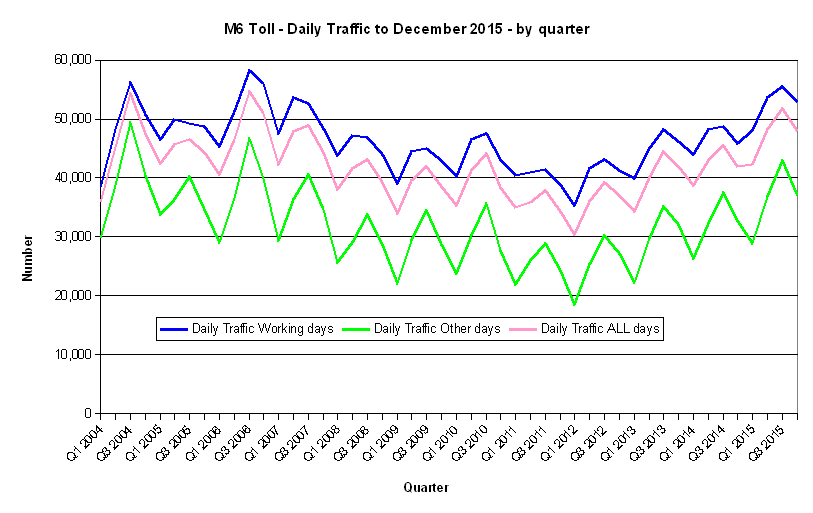
The first full month was January 2004. The traffic follows a seasonal pattern, peaking in the summer.
There have been toll increases in August 2004, June 2005, January 2007, January 2008, January 2009, March 2010, March 2011 and March 2012. Each increase has had little immediate effect on traffic, indicating that there is a hardcore of drivers who seem to be unaffected by the price.
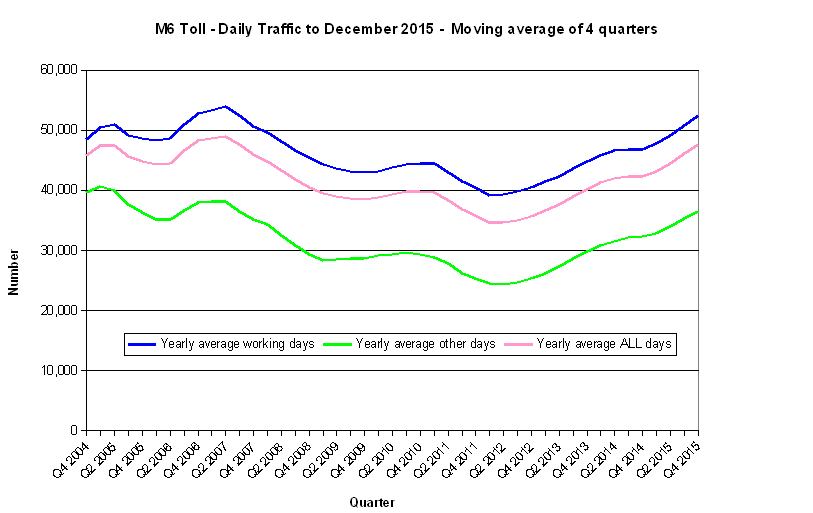
On a yearly average basis the traffic peaked in the second quarter of 2007, probably helped by road works on the equivalent stretch of the untolled M6 from June till December 2006.
The yearly average declined from that point The annual average of daily traffic reaching a low of 34,600 in the first quarter of 2012.
Since early 2012 the traffic has gradually crept up to a yearly moving average figure of about 47,600 a day at the end of 2015. This is 97% of the peak figure reached in 2007.
The Government inspired immigration and growth of population has added about six million people since the road opened and will have increased road use, but the greatest reason for growth is probably beacuse there has not been a toll increase since March 2012, there may also be some effect due to recent lower fuel prices.
Some of the Labour, Coalition and Tory Government actions over the last ten years have related to road works for hard shoulder running. This will have boosted traffic on the Toll road over that period but the works are due to end "early 2016" - our main M6 page - "The 'Smart Motorway' scheme on the M6.
There was another scheme in the pipeline and which the Toll Company was supposed to be paying for which was to link the east end of the M54 to the north end of the Toll road. The link made little sense to anyone but the Government. It would be possible to do this scheme without affecting the M6, but it seems that as part of it there would have been changes to Junction 11 on the untolled road, which might have been another opportunity for the Government to prolong the congestion. Despite that the scheme seems to have been abanndoned. Highways Agency - "M54 to M6/M6 (Toll) Link Road.
The long term effect of these schemes will hit the Toll company but as the Government have arranged it so that there will have been six years of traffic disruption from 2009 to 2015, this will have increased traffic on the Toll road during those years.
Charts below were based on the M6 Toll parent company's figures (below each chart). The parent company stopped producing figures after the 3rd quarter 2013, as in the fourth quarter the company reached a deal with the banks where the company ceased to gets the tolls though they still manage the road in return for a fee. The figures from the 4th quarter of 2013 are now as published by the Midland Expressway Limited, we assume that it is a concidence that the figures have increased since the change.
The first chart and set of figures is the annual moving average traffic. The second chart and set of figures is quarterly. Though the numbers seem high, when compared with the 200,000 vehicles a day on the untolled M6, the tolled road is empty as most drivers will avoid toll roads when they can.
Back to top
HOME
Back to M6 Toll main page